

Search engines and social media platforms are focusing more on keeping you on their website and monetizing your attention. Unfortunately for businesses, this means an ever decreasing amount of organic inbound traffic.
To help combat this, marketers are utilizing paid content syndication on apps like Feedly and Pocket to overcome organic losses and reach their audiences in new ways.
As with any new advertising channel, there’s always some confusion about how to run syndicated content campaigns and how to best measure success. Ultimately, it’s going to depend on your goals and types of content.
In this article we'll explain how to set up and measure the success of paid content syndication campaigns for brand awareness and lead generation.
Measuring brand awareness campaigns
Plenty of content marketing is done with the goal of generating awareness and reaching new people, and this type of content would be more or less referred to as top-of-funnel content.
In the case of Google Analytics, success metrics for syndicated content campaigns that promote this top-funnel content should focus on how new users engage with your website and content.
This is because first-time visitors are less likely to download a piece of content, sign up for a webinar, or start a free trial - unless those things are very closely related to the original reason for their visit. Remember the intention here is brand awareness and exposure - not necessarily immediate action.
For brand awareness campaigns, the following metrics can help quantify if your content is resonating with your audience and building your brand:
- New users
- Pages per session
- Average session duration
- Bounce rate
How to track brand awareness
All of these metrics are easily found in Google Analytics. If you have an attribution tool (think Kochava, Neustar, Altitude, or any other) or CRM installed that’s even better.
There are a few ways to set up Google Analytics to simplify the measurement and tracking of your paid content syndication.
For all of these things, the first step is making sure that the UTM codes in your campaign URLs are consistent. Hubspot has a great resource on UTM’s that explains what they’re about and how to build them out in Analytics here.
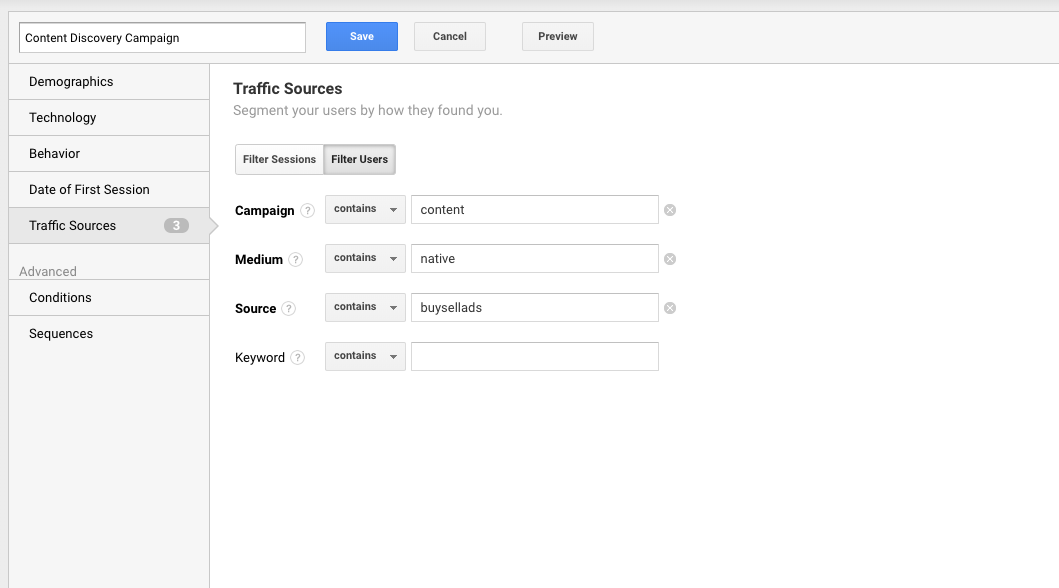
Create a custom segment
Once you’re in Analytics, you can create a custom segment that isolates users who are visiting your website from a paid content syndication campaign. Go into the segment builder, click on “Traffic Sources”, and filter by either users or sessions.
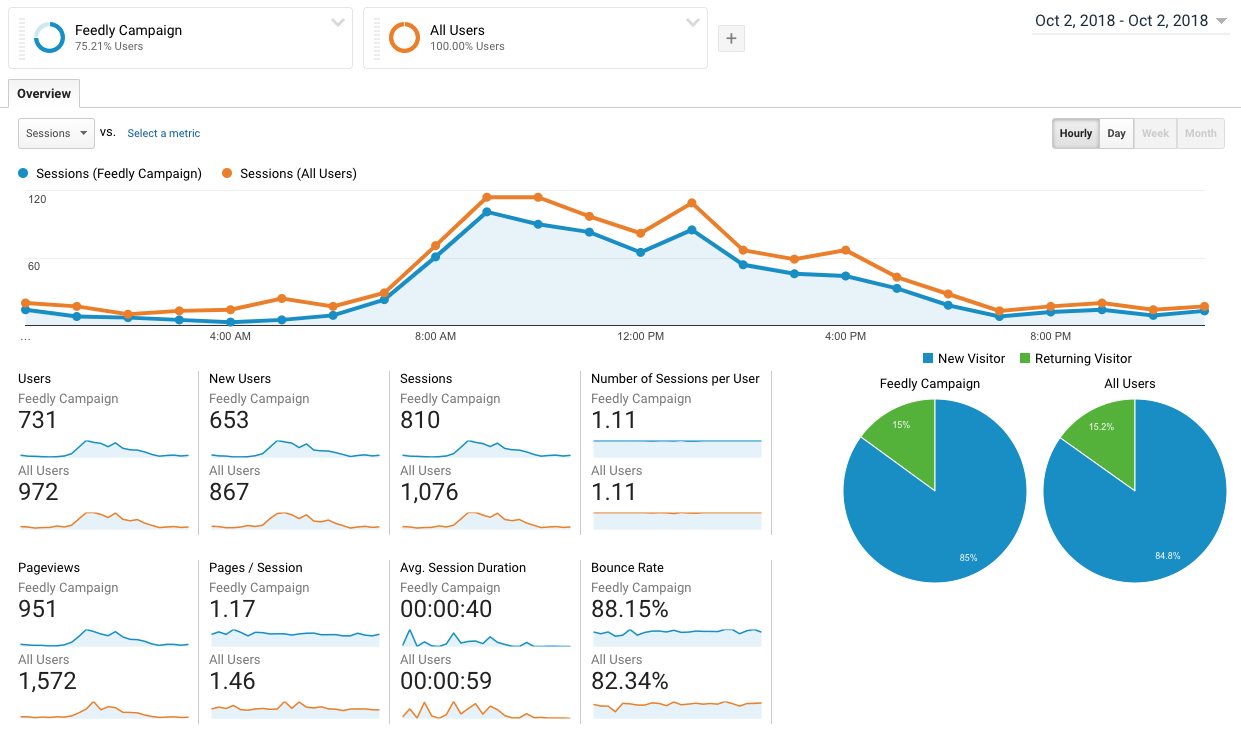
Once that’s created, you can compare user behavior by adding another segment to your view. In the example below, I can easily compare engagement metrics between a content syndication campaign and all users on my website.
Create a custom report
Custom reports are found under Customization → Custom reports. These let you easily access information without having to dig through separate reports in Google Analytics.
Creating a custom report is simple: add the dimensions that you want to feature in the report (source, page, landing page, or any other) and the metrics that you’d like insight into for each dimension. For this report, I added the basic engagement metrics mentioned above.
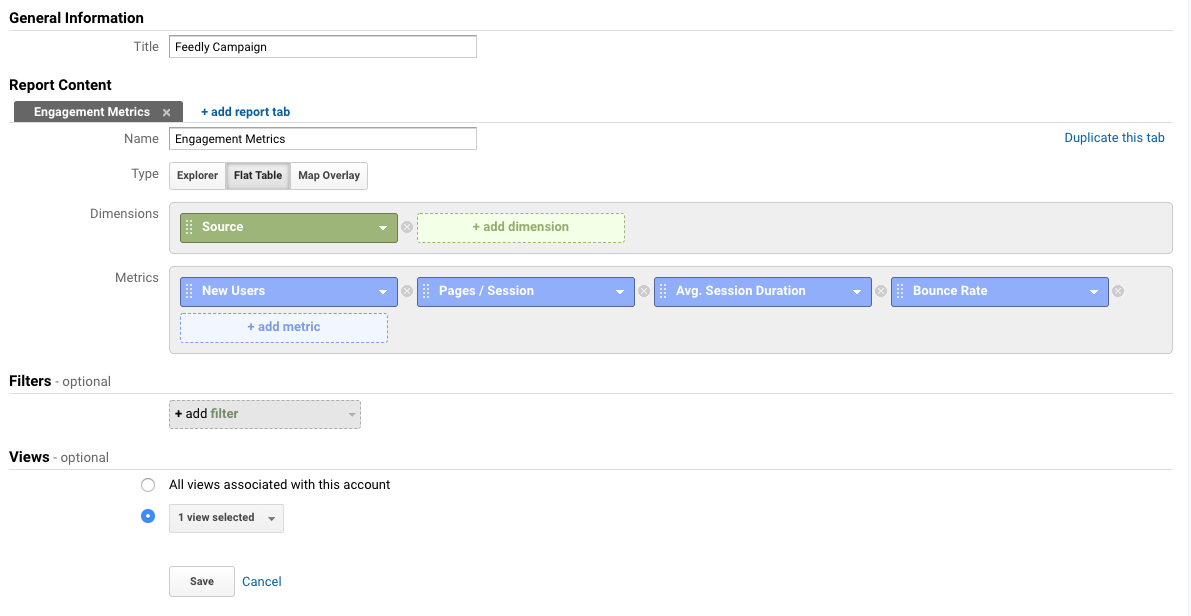
If you want insight into a specific campaign, you can filter your traffic directly in the report builder under “Filters." Keep in mind that the same filter is applied to all tabs in a report, which can be annoying if you want to compare performance from more than one campaign or source. If that’s your goal, ignore filters and instead use custom segment views once the report is built.
Measuring lead generation campaigns
Content marketing is only effective if it ties back to revenue, which is why mid-funnel content is so important for content distribution.
During a customer’s journey, they may reach a point when they transition from passively viewing top-funnel content to actively researching a solution to their needs.
Once they’ve kicked off this research phase, properly positioned mid-funnel content can help you get in front of your potential customer before your competitor, control messaging associated with your product, and build trust with your potential customer before others have the opportunity.
Content further down the funnel is often action-oriented and results in lead generation through sign-ups, free trials, or subscribes (depending on what your mid-funnel content is). In this case, this type of content can provide a directly measurable form of ROI for your business.
While engagement metrics make sense for measuring brand awareness campaigns, knowing how many leads were created is critical for understanding lead generation from your syndicated content.
Here, net new leads is a key metric, but it’s also worth tracking the engagement metrics discussed previously. These can often reveal a lot about campaign performance and targeting. For example, if users from lead generation campaigns are browsing several pages and leaving, they might need to be warmed up with branding campaigns before they move further down the funnel. Knowing the size of your entire funnel is important because only a fraction will eventually convert, and mid-funnel content is what can help make this happen.
How to track lead generation
Measuring leads created by a specific campaign is easily done in Google Analytics by setting up custom events or conversion goals. Again, if you have an attribution tool or CRM, you might prefer to figure out a workflow in there.
Creating a custom event
You can set up Google Analytics to log an event whenever someone completes an action on your website or app such as downloading a guide or subscribing to a newsletter.
Creating events in Google Analytics can be complicated, depending on how you track completions. If users are redirected to a dedicated thank you page, then all you need is the URL they are redirected to. If a message appears on-screen, things might get a bit more confusing. These guides for setting up events on Analytics and Tag Manager can help you better understand the process you’ll need for specific use cases.
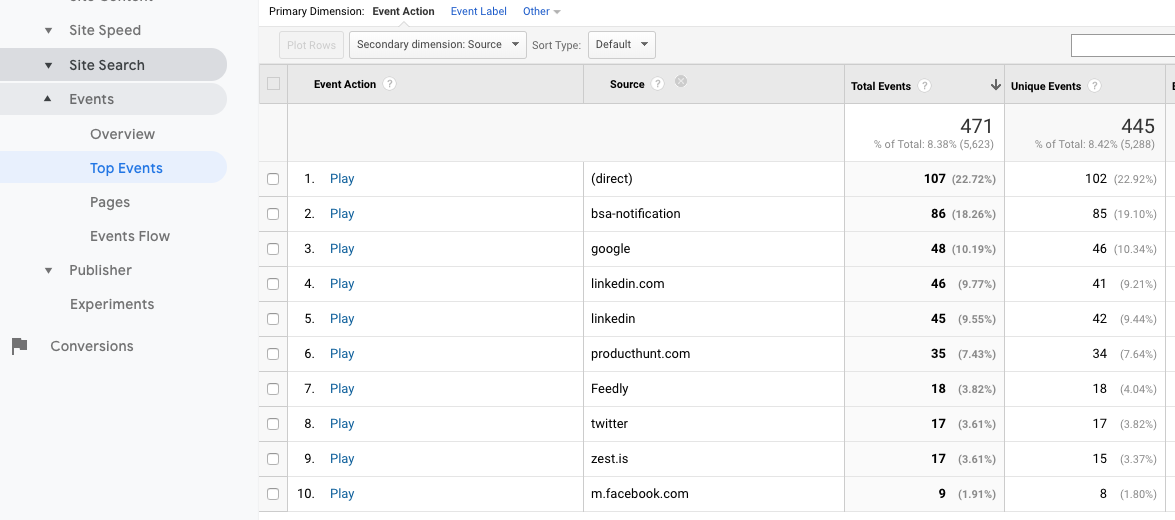
Once you’re tracking lead generation events, go to Behavior → Events and find the event category that refers to the content in your content syndication campaign. Click on it to get a more granular report and unlock the ability to add secondary dimensions such as source, medium, and campaign.
In the report below, you can see that Feedly referred 18 podcast plays on a particular day.
Adding events to a custom report
Events can be included on custom reports, giving you a comprehensive view of how campaigns are contributing to lead generation goals. On the report builder view, add total events or unique events under metrics. You can filter by specific events by setting up a filter for event action, label, or category.
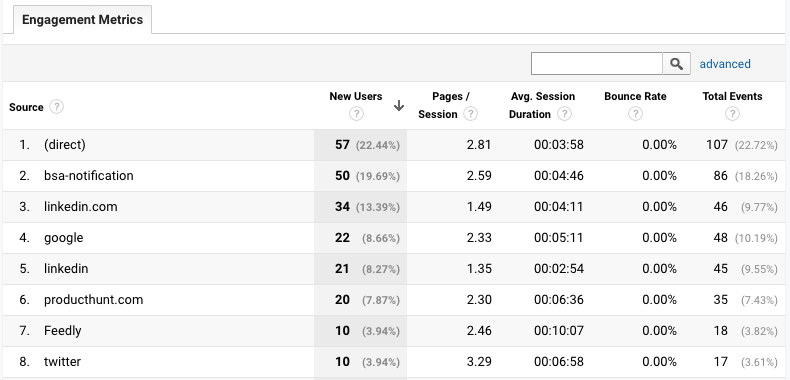
The custom report below shows engagement metrics and lead generation events for all users.
Measure for success
Syndicated content campaigns can help you reach more of your target audience, promote content for different funnel stages, and improve brand awareness, lead generation, and even customer delight. To run successful campaigns, pick your goal and then set up tools to measure campaign performance. Now all that’s left to do is to track, optimize, and repeat.